
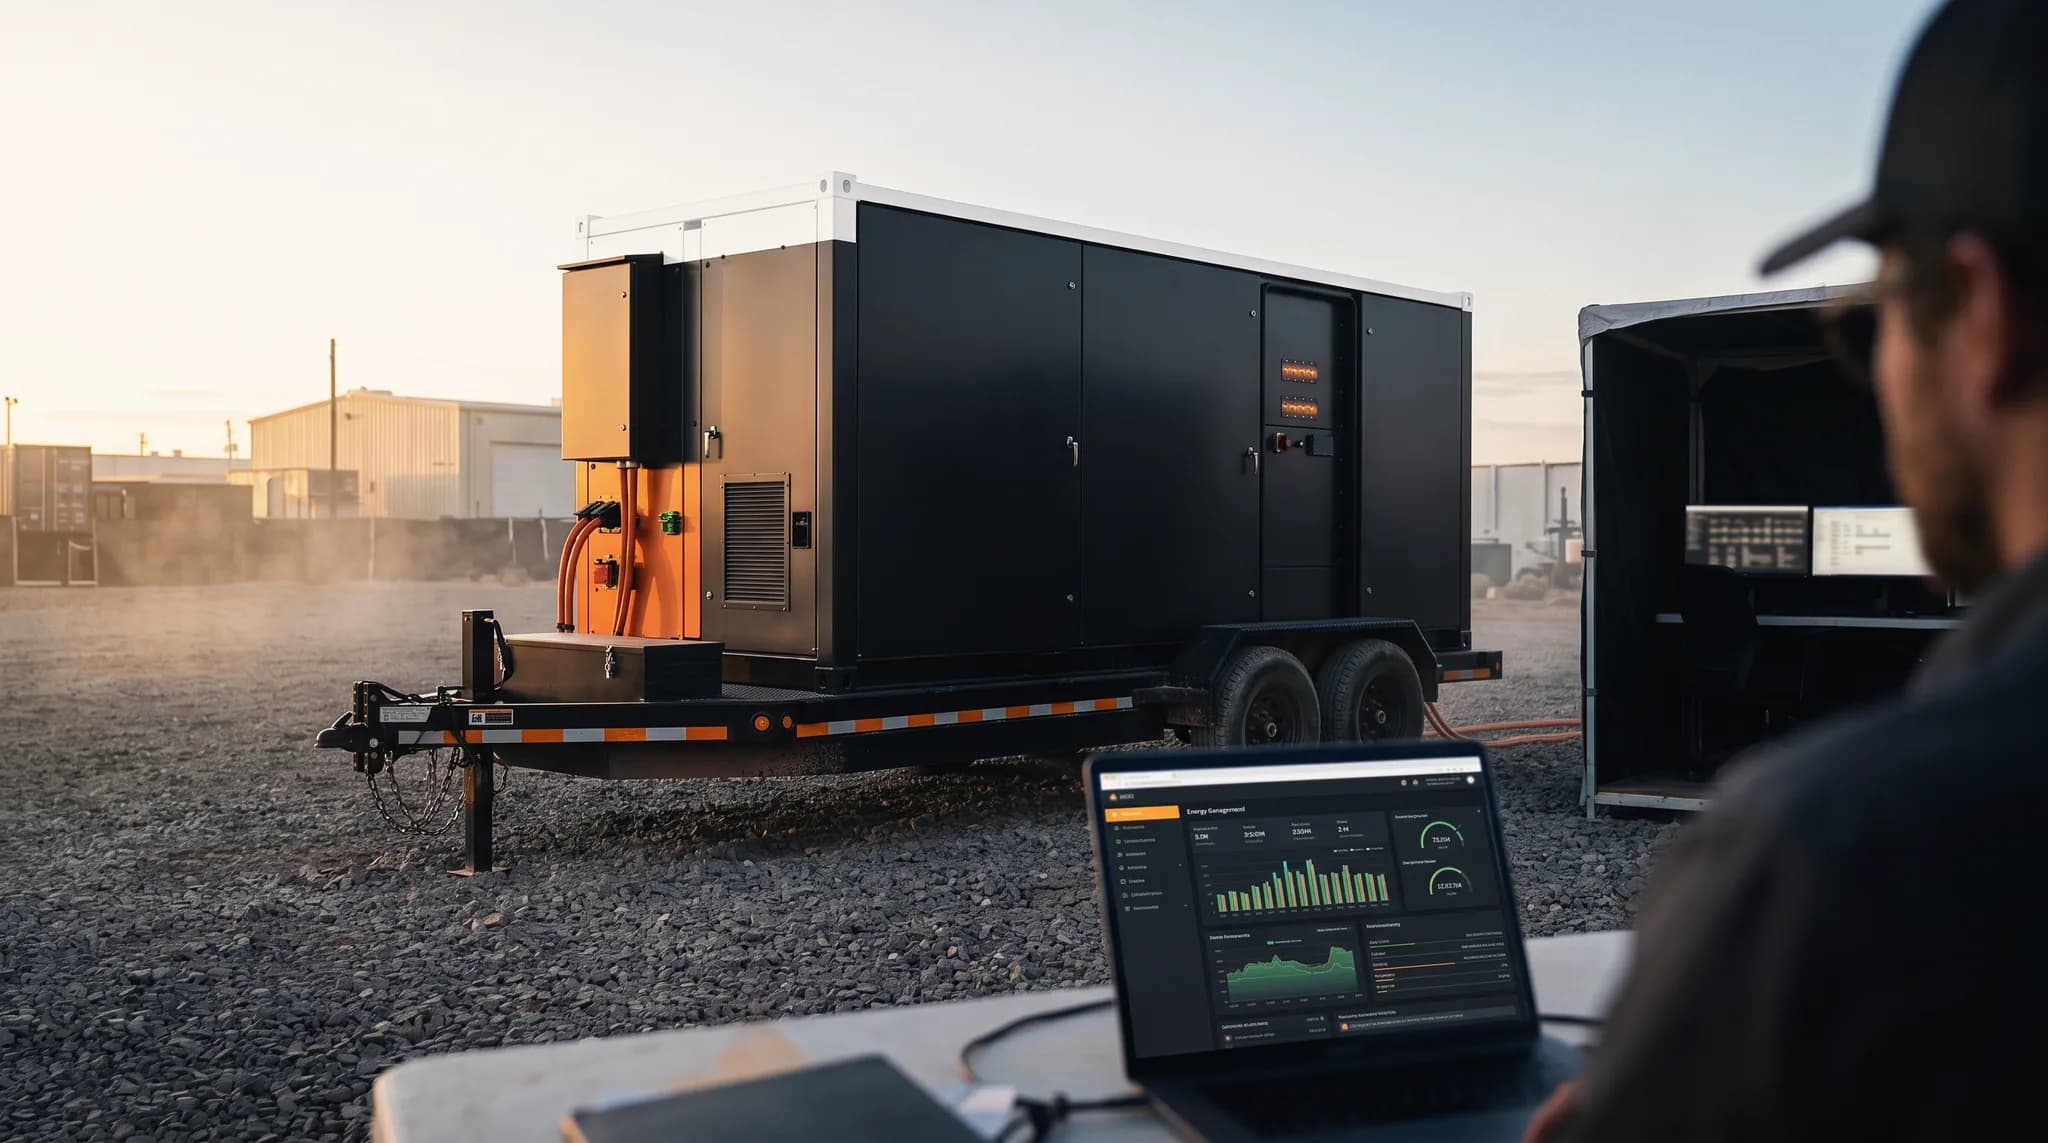
Equipment Portal
Dashboards
Built for the engineer who wants to see two units, five signals, one chart, right now.
Configurable means yours
Canned dashboards answer the vendor's questions. Yours answer the question you have today: does the pack on unit two heat up faster than the one on unit five under the same load? Overlay them and look. Set the thresholds that match how you actually run the equipment, and let the alerts come to you.
And when the data needs to leave the portal for a report or an analysis, it does: CSV for any charted signals, or a full service session captured to a multi-sheet Excel workbook.
What you can do
- Overlay any combination of signals across multiple units on one time-series chart
- Preset or custom time ranges, with a live mode that keeps the chart current
- Automatic dual-axis scaling when signals live in different units
- Per-unit dashboards where you choose how each signal displays and what its range is
- Your own warning and critical thresholds, per signal, per unit
- Export any charted signal set to CSV
- Capture a service session to a multi-sheet Excel workbook
- Fleet map and location history
Take it to the field.
The same fleet, on your phone, with Bluetooth access at the unit.